Key takeaways
- LinkedIn engagement rate is interactions divided by impressions, reach or followers, times 100; there is no single official formula.
- A good rate is usually 3-5% by impressions; HookTide puts the typical range at 2-6% by impressions.
- Buffer reports LinkedIn's median engagement rate rose from 6.00% in January 2024 to 8.01% in January 2025, with a 2025 average of 6.50%.
- Hootsuite's January 2025 data shows a 3.9% average for consumer goods and retail, which is not a target for other industries.
- Compare each post with your own 60-90 day baseline and with posts of the same format before using outside benchmarks.
LinkedIn engagement rate is the share of people who reacted, commented, reposted or clicked, divided by impressions, reach or followers and multiplied by 100. Measured by impressions, a rate of about 3-5% is good in 2026, though the format of the post and the size of your audience move that baseline.
The number matters because a quiet post gives you no clue on its own. Picture a post with a clear argument, a clean hook and a topic your audience says it cares about, sitting under a handful of likes with no discussion. From the likes alone you can't tell whether the idea was weak or too few people saw it. Most LinkedIn advice says "post better content" and skips the one metric that answers that question.
Whether you run a founder profile, a company page or your own account, this rate tells you more than the follower count. It lets you judge posts, compare formats and stop guessing, and it keeps you from deciding things based on vanity metrics.
Why do LinkedIn posts get ignored?
Usually for one of two reasons. Either the post gives readers no reason to respond, or it gets shown to people and still doesn't collect enough interaction to keep travelling.
The second reason weighs more now, because interaction on LinkedIn has been rising. Buffer reports that LinkedIn's median engagement rate rose from 6.00% in January 2024 to 8.01% in January 2025, and that its 2025 average engagement rate of 6.50% was the highest among major social platforms. Buffer also counts 1.4 billion visits to LinkedIn in May 2025, so these rates come from a very large platform and not a small niche network (Buffer's LinkedIn statistics).
So when your posts get ignored, LinkedIn being "dead" is rarely the cause. More often the post drew too little response for the number of people who saw it.
The fix starts with structure. For a clear method covering hooks, positioning and planning, this LinkedIn posting strategy is worth reading, since it deals with how a post is built instead of general motivation.
Rule of thumb: your follower count shows how many people decided to connect with you. Your engagement rate shows whether your posts still earn their attention.
A quiet post and a weak account are different problems. Any single post can miss. A run of low rates means the format, the topics or the closing question need work.
A useful order for judging a LinkedIn account:
- Response to the post comes first: whether people reacted, commented or shared.
- The rate comes second: whether that response held up against the number of people who saw the post.
- Follower growth comes third: whether the good posts turned into a bigger audience over time.
When a new post needs early discussion, even a few comments give the algorithm something to work with. Some people share new posts in a community for LinkedIn comments as part of their publishing routine. Either way, the rate tells you more than the raw count.
How do you calculate LinkedIn engagement rate?
People often assume LinkedIn has one official formula for engagement rate. It doesn't; the right formula depends on what you want to measure.
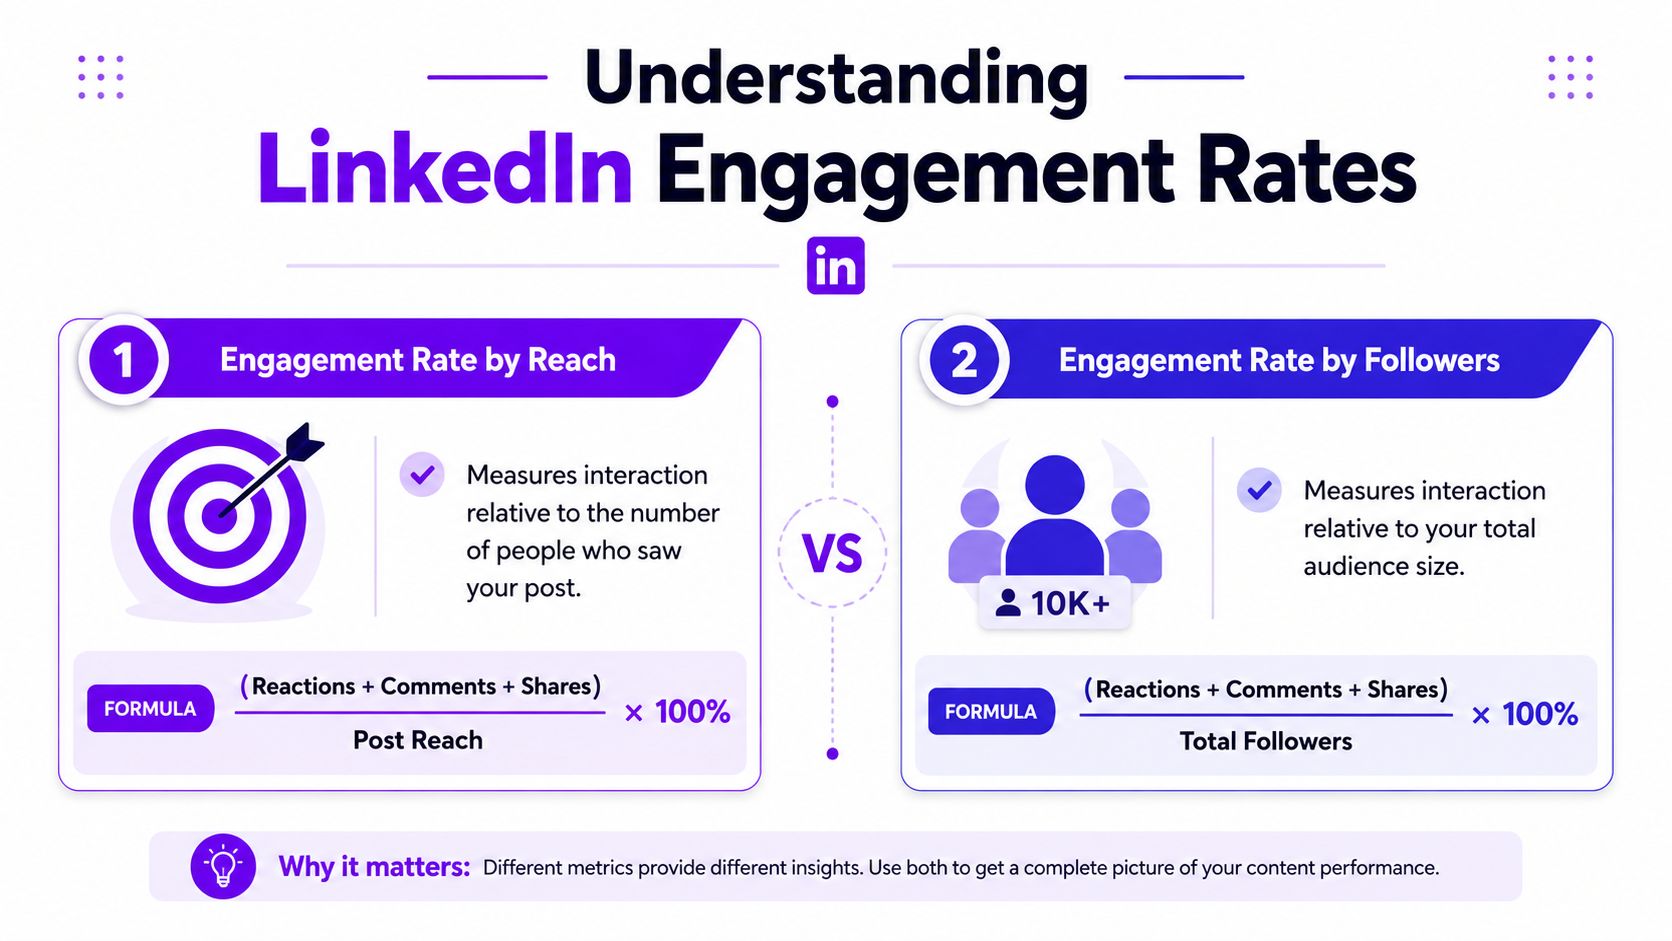
Why the denominator matters
Most reports skip this part. Many guides never say whether you should divide by impressions, reach or followers. HookTide notes that engagement rate is usually described as interactions divided by impressions or by followers, and puts typical rates at 2%-6% by impressions (HookTide's LinkedIn engagement rate guide).
So two people can report very different rates for the same post, and neither has made a math mistake. They divided by different numbers.
In plain terms:
- Impressions count how many times the post was displayed.
- Reach counts how many separate people saw it.
- Followers count your whole audience, including many people who never saw that particular post.
Switching the denominator gives you a different metric with the same name, so the numbers stop being comparable.
The three formulas people confuse
Pick the formulas you need, apply them the same way every time and label them in every report.
- Engagement rate by impressions
(Total interactions / Impressions) x 100
Best for comparing how well a post did relative to how often it appeared in feeds. - Engagement rate by reach
(Total interactions / Reach) x 100
Best for seeing what share of the people who saw the post chose to interact. - Engagement rate by followers
(Total interactions / Total followers) x 100
Useful as a rough view of the whole account, weaker for judging one post.
A rate based on followers can make a post look worse than it was, and a rate based on reach can make the same post look better. Only the denominator changed between the two numbers.
Calculators also disagree about what counts as an interaction. Some include only reactions, comments and shares; others add video views and link clicks. Social Status uses a reach-based benchmark that counts video views and link clicks, which makes its numbers clearly different from follower-based calculators. That is why asking what a good engagement rate is only makes sense together with the question of which formula was used.
The LinkedIn engagement rate calculator shows the result for each base side by side.
Which formula should you use?
For reviewing posts week to week, a formula tied to distribution (impressions or reach) works better than one tied to audience size. For wider reporting, a second view based on followers shows how the account develops over time.
A clean setup:
- Impressions or reach for post analysis, when you compare topics, hooks and formats.
- Followers for tracking the profile, when you want to see how the account does over longer periods.
- A fixed list of interaction types, so you don't count clicks one month and leave them out the next.
If you get early likes through a community such as LinkedInLikes, keep measuring every post with the same formula. Otherwise your reports stop being trustworthy.
What is a good LinkedIn engagement rate in 2026?
Take two posts. A SaaS founder shares a sharp product lesson on Tuesday and gets a few comments and a healthy click-through rate. On Wednesday a recruiter posts a hiring story and gets far more reactions from a smaller audience. Both want to know whether their result is good for LinkedIn, and the answer depends on the formula, the industry and the format.
This is why platform-wide benchmark figures cause trouble. A number can be correct within one method and still useless for your reports if you calculated your own rate another way.
One published benchmark shows the problem. Hootsuite's January 2025 data puts the average LinkedIn engagement rate for consumer goods & retail at 3.9%, as reported in this industry benchmark coverage. It helps retail teams. It is not a target for B2B SaaS, recruiting, consulting or founder-led personal brands.
LinkedIn engagement rate benchmarks by industry, 2026
Only one industry-specific figure appears in the verified sources behind this article:
| Industry | Average engagement rate |
|---|---|
| Consumer goods & retail | 3.9% |
That gap is worth knowing about. Many benchmark roundups quote wide ranges with more confidence than their data supports. Teams make better calls with a narrower set of comparisons, in this order:
- Your own baseline first. Use the last 60 to 90 days to define what is normal for your page or profile.
- Industry figures second. Use outside benchmarks only when their formula matches yours.
- Format third. Compare text posts with text posts, documents with documents and video with video.
This order prevents a frequent reporting error: comparing a document post with an account average pushed up by video, or comparing a founder profile with brand-page benchmarks, and then deciding the content failed when the comparison itself was wrong.
Why format changes the benchmark
Format moves the baseline quickly on LinkedIn. Document posts often hold readers longer and collect more saves. Native video can bring in views that make a post look strong in one calculator and average in another. Plain text can still win when the hook is specific and the comments stay active, though its strength is the quality of the conversation more than the volume of interactions.
So treat benchmarks by content type as working tools. If your text posts regularly bring informed comments from potential clients, they may be doing their job even when a document post collects more surface-level reactions.
A useful benchmark answers a narrow question: how does this type of post perform for this account, in this industry, under this formula. That is the standard to use in 2026.
How do you measure your engagement rate step by step?
Most reporting problems start before any math, with untidy data collection. People copy numbers from different screens, mix formulas and then can't see why the monthly report doesn't add up.
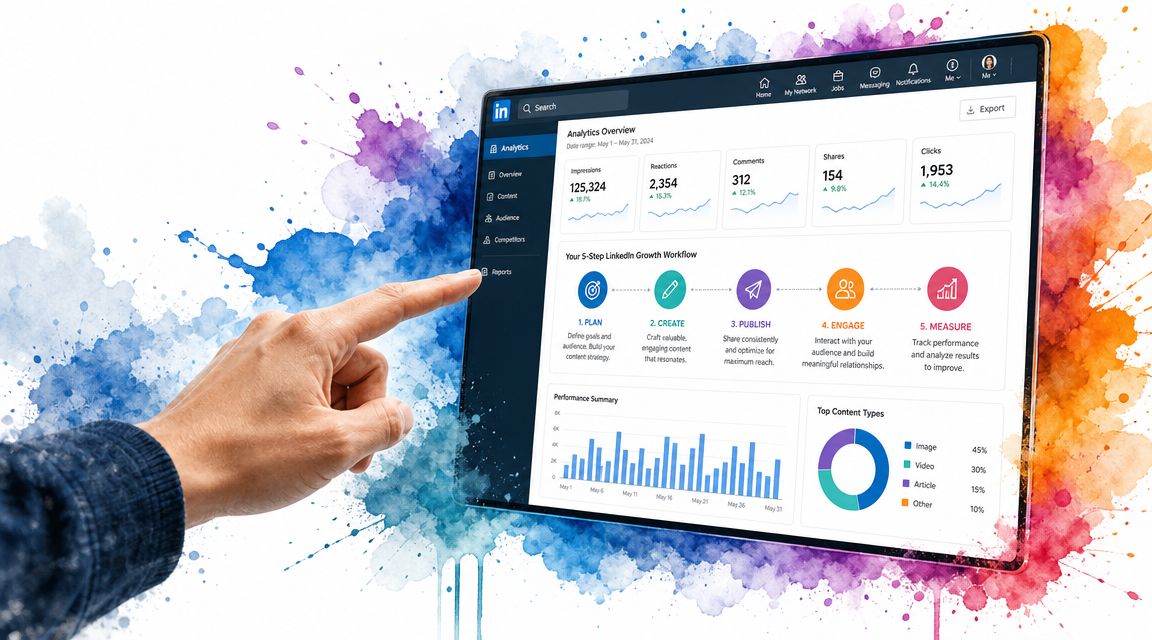
Collect numbers for each post first
On a personal profile, open the analytics for the specific post and note the same fields each time. On a company page, use the page analytics dashboard and export or log metrics for each post on a fixed schedule.
A simple sheet with these columns is enough:
- Post date, so comparisons over time stay clean
- Format, such as text, document, carousel or video
- Topic, so you can group posts later
- Interactions, counted with one fixed definition
- Impressions, reach or followers, depending on the formula you picked
- Engagement rate, with the formula written in the column header
Keep the tracking sheet consistent
A good worksheet is stable more than clever.
Keep one tab for raw post data and one for summaries. Don't rename labels in the raw tab from week to week. If your definition of interactions covers comments, reactions and reposts, leave it that way. If you also count clicks, mark it clearly and never mix those posts with ones measured more narrowly.
Habit worth keeping: write the exact formula at the top of the report. That single line removes half the confusion in team reviews.
A weekly routine that works:
- Collect the newest post metrics on the same day every week.
- Tag every post with its format and topic.
- Calculate one main engagement rate.
- Look at the outliers by hand to see whether the comments, the format or the topic caused the swing.
Mistakes that break the reports
Most bad LinkedIn reporting comes from the same few errors:
- Changing the denominator halfway through a report. If one post is divided by impressions and another by followers, the comparison falls apart.
- Judging a post too early. Some posts gather discussion slowly.
- Reading one post on its own. A single spike or dip can distort the picture.
- Ignoring what the post was for. A hiring post and an opinion post shouldn't always be held to the same standard.
For cleaner decisions, compare like with like: text posts with text posts, documents with documents, one topic group with the same group. The number becomes useful once the context is held constant.
How can you raise your LinkedIn engagement rate without tricks?
Higher rates come from posts that make the right people stop, react and add something of their own.

Use formats that invite interaction
Some formats produce more activity than others. Recent benchmark coverage, cited above, recommends native video and document posts, because in the current LinkedIn content mix they tend to bring more interaction than simple text updates.
Text posts still have their place; each format does a different job:
- Document posts work when one idea splits naturally into pages people want to click through.
- Native video works when the speaker has something to say and gets to it quickly.
- Polls can bring light interaction, but the feedback is often shallow.
- Text posts still work when the opening line is sharp and the body builds tension or asks for a genuine opinion.
The strongest comment threads tend to come from posts that do one of three things well: question a common habit, explain a hard lesson in plain words, or ask a question with enough context that readers can answer from their own experience.
Take the first hour seriously
In the first hour LinkedIn is still deciding how far to send the post. Early reactions give distribution a better chance to continue; with no reactions at all, even a good post can stop short.
That is why activity right after publishing gets so much attention. LinkedInLikes is a free community built around that first hour: members like, comment on and follow each other's LinkedIn posts and profiles by hand, from their own accounts. It also covers networking actions such as LinkedIn connection requests.
Early activity holds up best when it comes from people who can read the post and respond the way readers normally do.
The same first-hour logic leads some teams to study audience lists and public profile data to see who tends to react to certain topics. If you work that way, this explanation of social media scraping for LinkedIn covers how it works and where the limits are before you collect anything.
In short:
- Reply quickly. Early comments deserve fast replies, since replies can extend the thread.
- Ask for one specific response. Broad questions get ignored and narrow prompts get answered.
- Publish when you can stay around. Don't post and then disappear for the day.
What usually flops
Plenty of LinkedIn content with low rates looks polished and says very little. The weak patterns are easy to spot:
- Corporate announcement tone. People scroll past posts that read like internal press releases.
- Long warm-ups. When the main idea shows up late, the reader has already left.
- Empty prompts. A bare "Thoughts" at the end of a bland post rarely gets answers.
- Over-produced video. When it looks too polished, people often treat it as an ad.
Plain language, a clear opinion and a reason for someone to join the thread work better. On LinkedIn, comments are usually the clearest sign that a post started an actual discussion instead of collecting passive approval.
Community growth or shortcuts: what is the trade-off?
When rates stay low, people start looking for speed, and that is when the bad options show up.
The slower route holds up better. People who actually read a post react unevenly. They leave comments of different lengths, ask follow-up questions and sometimes disagree. That activity looks normal because it is.
The trade-off in simple terms:
| Approach | What you get | What it costs |
|---|---|---|
| Community-based interaction | Actions done by hand by members from their own accounts | Your own participation and a routine |
So don't treat every kind of support the same. The label on a tool tells you very little. What matters is whether the activity comes from people acting on their own accounts and whether the process is open and accountable. On LinkedInLikes, a post owner can report an action that wasn't done within 72 hours, and accounts detected as fake or automated are removed.
Bottom line: shortcuts that manufacture demand rarely build a profile people trust. Interaction from actual readers gives you a chance at repeat attention.
The aim is enough early activity for a good post to keep moving, after which the post has to stand on its own. To try that on your next post, create a free LinkedInLikes account; you get 100 starter points after confirming your email.
More on growing on LinkedIn
- Free LinkedIn growth course
- How LinkedIn pods work
- Swapping likes and comments on LinkedIn
- LinkedIn like exchange
- Connect for connect on LinkedIn
- How to do like for like on LinkedIn
- Like for like (L4L)
- How to grow on LinkedIn in 2026
- How to request a connection on LinkedIn
- LinkedIn SEO: getting found in search
Frequently asked questions
About 3-5% by impressions is usually good. HookTide puts typical rates at 2-6% by impressions. Compare against your own 60-90 day baseline before outside numbers.
Divide total interactions by impressions, reach or followers and multiply by 100. Pick one base and one list of interaction types, and keep both fixed. The LinkedIn engagement rate calculator does it for you.
Use impressions or reach to compare individual posts, and followers to track the account over longer periods. Label the formula in every report.
Buffer reports a 2025 average of 6.50% and a median that rose from 6.00% in January 2024 to 8.01% in January 2025. Hootsuite's January 2025 figure for consumer goods and retail is 3.9%. Each uses its own method.
Native video and document posts tend to bring more interaction than plain text updates. Text still works when the hook is specific and the comments stay active.
It depends on the calculator. Some count only reactions, comments and shares; others, such as Social Status's reach-based benchmark, include video views and link clicks.